to leave a comment.
▲ Cardano (ADA)/ChatGPT generated image
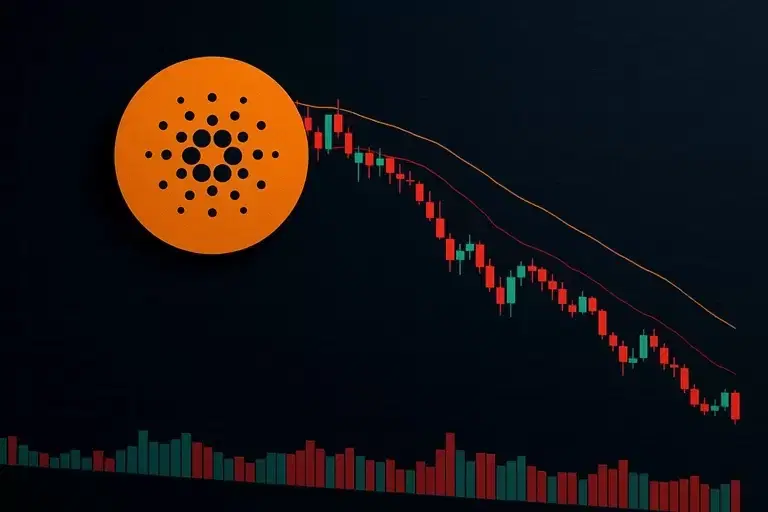
Cardano (ADA) price traded above $0.250 on Wednesday, rebounding slightly after a five-day consecutive decline since last week. On-chain data indicates that whale wallets have been accumulating Cardano during the recent price correction, suggesting sustained long-term interest in the altcoin. Despite this buying activity, weakened technical momentum and mixed sentiment in the derivatives market continue to limit Cardano's recovery.
According to FXStreet on May 20 (local time), Santiment's supply distribution data supports a positive outlook for the token, showing that whales, large wallet holders, are buying Cardano, taking advantage of the recent price drop. The indicators show that whales holding 100,000 to 1 million ADA, 1 million to 10 million ADA, and large whales holding 10 million to 100 million ADA have accumulated a total of 250 million ADA since May 11. This "buy the dip" scenario suggests sustained long-term interest among large wallet holders and could act as a buffer against price declines.
Conversely, the mixed sentiment in the derivatives market is a factor limiting Cardano's recovery potential. CoinGlass's long-short ratio recorded 0.80 as of Wednesday, nearing its lowest level in a month. A ratio below 1 reflects bearish market sentiment, meaning more traders are betting on a decline in asset prices. In contrast, funding rates supported an improvement in sentiment. CoinGlass's open interest weighted funding rate data turned positive on Sunday and recorded 0.0072% as of Wednesday. This positive funding rate indicates that long positions are paying short positions, reflecting a moderate bullish sentiment.
Cardano's price is trading at $0.250 as of Wednesday, remaining below the 50-day, 100-day, and 200-day exponential moving averages (EMAs) located at $0.258, $0.280, and $0.355 respectively, maintaining a short-term bearish trend. The fact that it is positioned below a downward resistance trendline connecting several highs recorded since early January also poses a burden. The Relative Strength Index (RSI) on the daily chart fluctuates around 43, and the Moving Average Convergence Divergence (MACD) remains in negative territory. The lackluster performance of both indicators suggests subdued momentum, supporting the likelihood that any price rebound will be limited by nearby EMAs and Fibonacci resistance levels rather than leading to a sustained recovery.
The first resistance level to face when moving upwards in the future is the 50-day EMA near $0.258. Even if this is broken, the 23.6% Fibonacci retracement level drawn from the January high to the February low at $0.271 and the trendline breakout level at $0.274 await. Additional barriers are formed consecutively by the 100-day EMA near $0.280, the horizontal resistance at $0.299, and the 38.2% Fibonacci retracement level at $0.303. Conversely, the immediate support level on the downside is the horizontal price level of $0.245, and if this breaks, it could push down to $0.236, followed by the Fibonacci anchor near the February low at $0.220. In the event of further deep correction, a more robust demand zone is expected to form in this area.
*Disclaimer: This article is for investment reference only, and we are not responsible for any investment losses based on it. The content should be interpreted for informational purposes only.*
Newsletter
Get key news delivered to your email every morning
to leave a comment.