
to leave a comment.
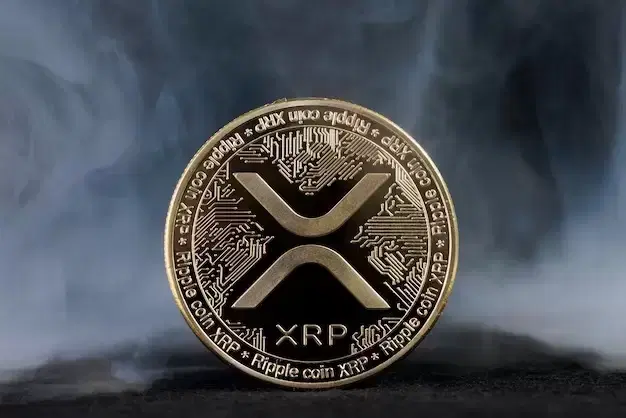
▲ Ripple (XRP) ©Go Da-sol
An analysis suggests that XRP (Ripple) has entered the final stage of the bear market, having closed two consecutive months trading below its monthly 50-period moving average. If past trends repeat, the price could drop an additional 25-40% to $0.80-$0.65.
According to crypto-specialized media Finbold on August 4 (local time), TradingShot, in an analysis published on TradingView, stated that XRP closed two consecutive months below its monthly 50-period moving average for the first time since June 2024. At that time, XRP was trading in a long-term accumulation zone before the start of the previous bull market.
TradingShot analyzed that the current trend is similar to the 2021-2022 bear market. At that time, the price formed a bottom after finding support at the monthly 100-period moving average. Applying the ascending Fibonacci channel that has guided the price for a long time, this potential bottom is suggested to be $0.80-$0.65. This range also overlaps with the buying zone over the past six years.
The upper end of the expected range, around $0.80, coincides with the monthly 100-period moving average, while the lower end aligns with the monthly 150-period moving average. $0.65 is just below the 0.618 Fibonacci retracement level, which formed the June 2022 low. The media reported that these long-term technical indicators point to the possibility of a bottom forming after further decline.
The monthly Relative Strength Index (RSI) also indicated the possibility of further correction. In the past, strong long-term buy signals for XRP appeared when the RSI reached its descending low trendline, and the same pattern was observed at the cycle bottoms in 2020 and 2022. Currently, the indicator is approaching this trendline again, suggesting that a new buy signal could emerge within the next 3-4 months, but the price might fall further before then. If the long-term high resistance line is broken after the correction ends, there is also a possibility of a surge to $6 with a new bull cycle.
At the time of writing, XRP was trading at $1.07, up approximately 0.5% over the day and 1.5% over the week. However, it was trading below both the 50-day simple moving average of $1.10 and the 200-day moving average of $1.35, indicating an overall bearish trend. The 14-day Relative Strength Index recorded a neutral level of 45.43, but being below the baseline of 50, it suggests that bearish momentum remains, and there is still room for further decline as it is not yet oversold.
*Disclaimer: This article is for investment reference only, and we are not responsible for any investment losses based on it. The content should be interpreted for informational purposes only.*
Newsletter
Get key news delivered to your email every morning
to leave a comment.