
to leave a comment.
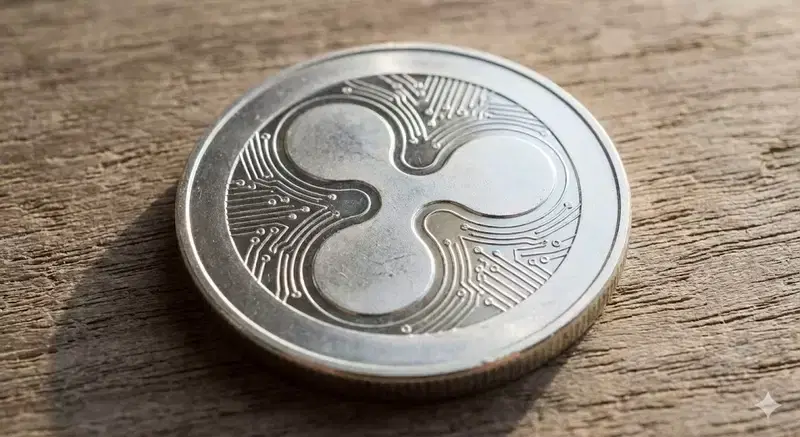
▲ XRP (XRP)/AI-generated image
XRP entered a downward correction in the $1.3740 range, increasing short-term bearish pressure. If it fails to recover the $1.360 resistance level, further selling pressure may follow, and if the key support level of $1.3280 breaks, the possibility of retesting $1.30 opens up.
NewsBTC reported on May 26 (local time) that XRP began a downward correction after failing to hold above the $1.3620 level. XRP fell below $1.3580 and the 100-hour simple moving average, and a bearish trend line with $1.360 as resistance formed on the hourly XRP/USD chart based on Kraken data.
After failing to hold above $1.3720, XRP slipped below $1.3620 and $1.3600. It then fell below $1.3550 and temporarily dropped below the Fibonacci 50% retracement level of the upward move from the $1.30 low to the $1.3740 high. However, analysis also suggested that if it maintains above the $1.320 level, it could attempt another ascent.
In the rebound phase, the area around $1.350 was mentioned as the first resistance level. The first major resistance is $1.3560, and if it surpasses this level, a test of $1.360 is possible. A clear break above the $1.360 resistance could lead XRP towards the $1.3720 resistance, and with further gains, it could move up to $1.3750. For bulls, the next key obstacle is near $1.380.
Conversely, if XRP fails to clear the $1.360 resistance zone, the downward trend could strengthen again. The first support level below is $1.330, and the next major support aligns with $1.3280. This zone coincides with the Fibonacci 61.8% retracement level of the upward move from the $1.30 low to the $1.3740 high.
If it breaks below $1.3280 and forms a closing price, XRP could extend its decline to $1.3175. The next major support level is $1.3120, and if even that level breaks, it could lead to a test of $1.30 after $1.3050. The hourly Moving Average Convergence Divergence (MACD) index accelerated in the bearish zone, and the hourly Relative Strength Index (RSI) fell below 50. Key support levels were presented as $1.3280 and $1.3120, and key resistance levels as $1.3550 and $1.3750.
*Disclaimer: This article is for investment reference only, and we are not responsible for any investment losses based on it. The content should be interpreted for informational purposes only.*
Newsletter
Get key news delivered to your email every morning
to leave a comment.